Firewall Issue at University of Waterloo
While developing user dashboards for the SAND project, we identified a significant issue with all perfSONAR testing to the University of Waterloo. You can see our dashboard for March 10-13, 2020.
This plot that caught our attention:
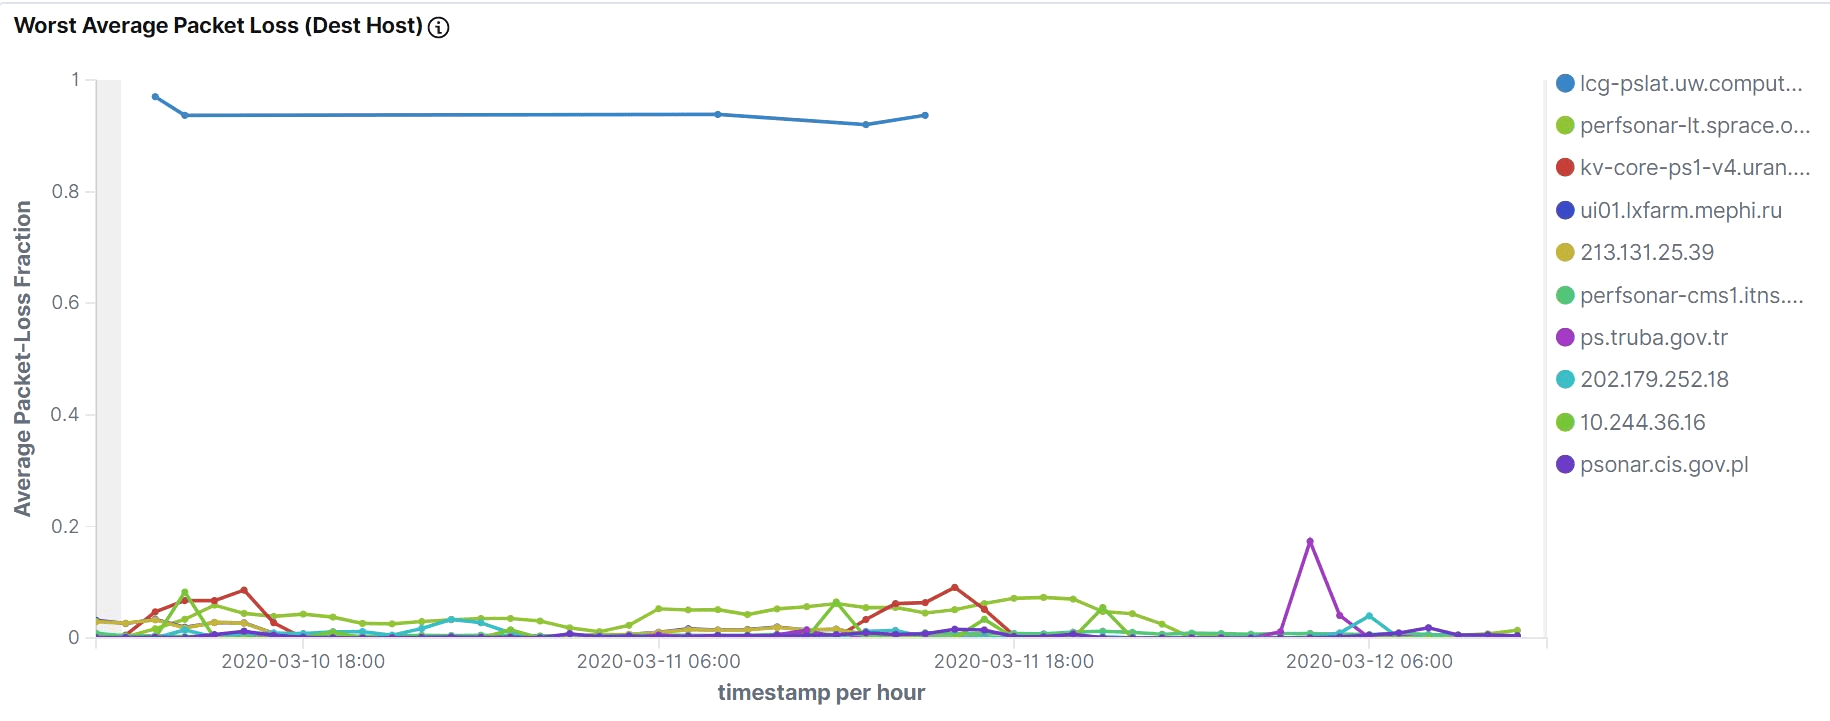
The top “Worst Packet Loss” as a destination was lcg-pslat.uw.computecanada.ca (see ordered legend on the right), a perfSONAR latency instance at the University of Waterloo.
We can easily use this Kibana dashboard to focus on this site as a destination. If we click on the lcg-pslat in the legend we see:
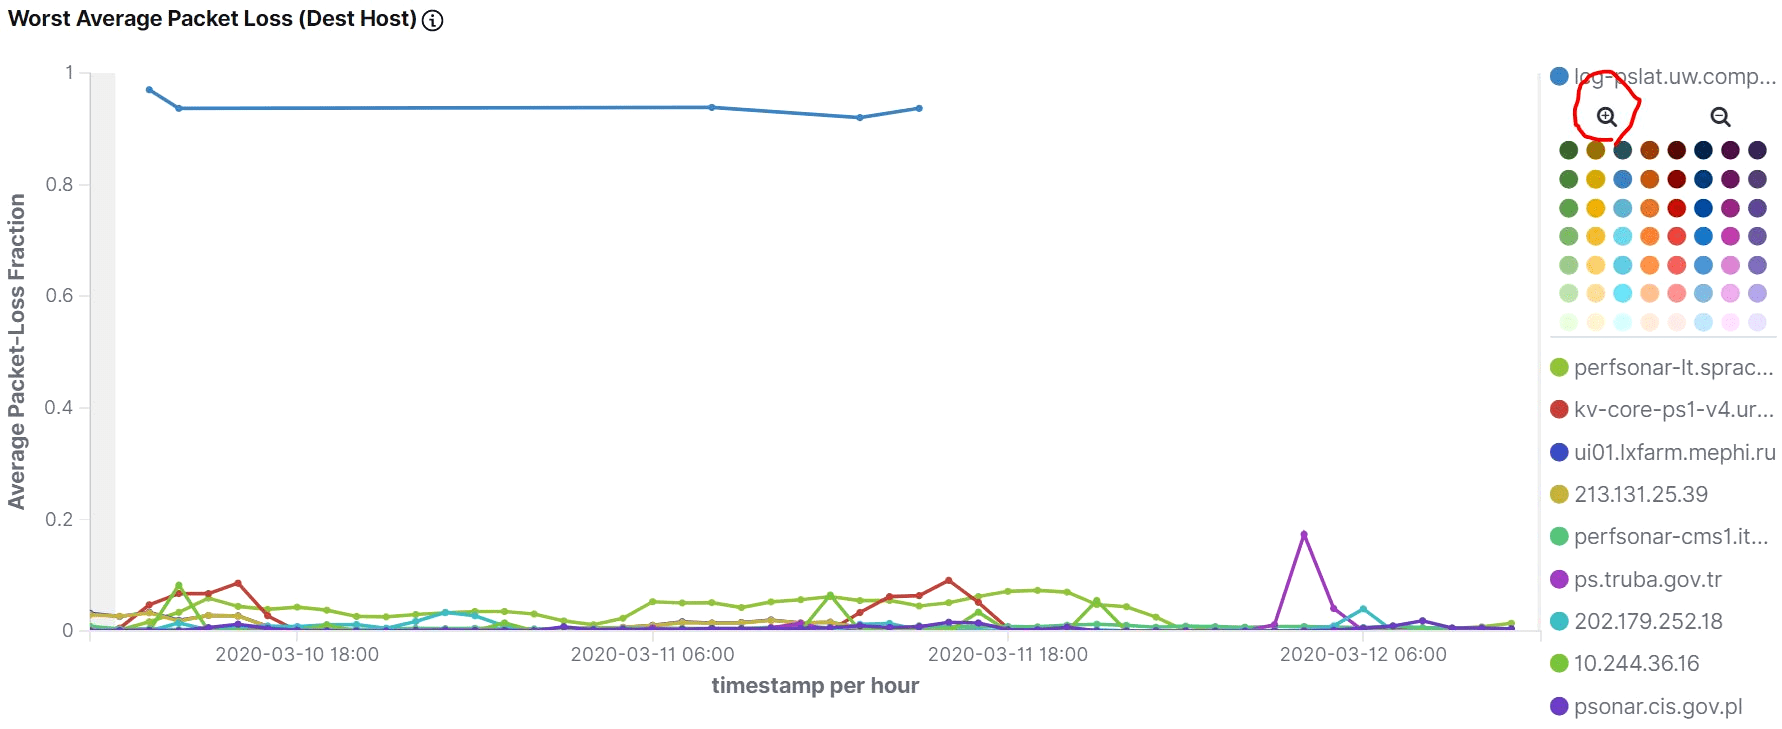
If we click the magnifying glass icon with the + in it, we apply a filter to the whole dashboard, requiring that lcg-pslat.uw.computecanada.ca be the destination for any visualizations shown. You can try it yourself by using the above link.
Once this filter is in place we can see that every latency test (packet-loss test) destined to this University of Waterloo node is seeing 100% packet loss, except for one instance ( perfsonar02-iep-grid.saske.sk) which had some packets get through. The table at the bottom of the Packet-Loss dashboard can be used to see this:
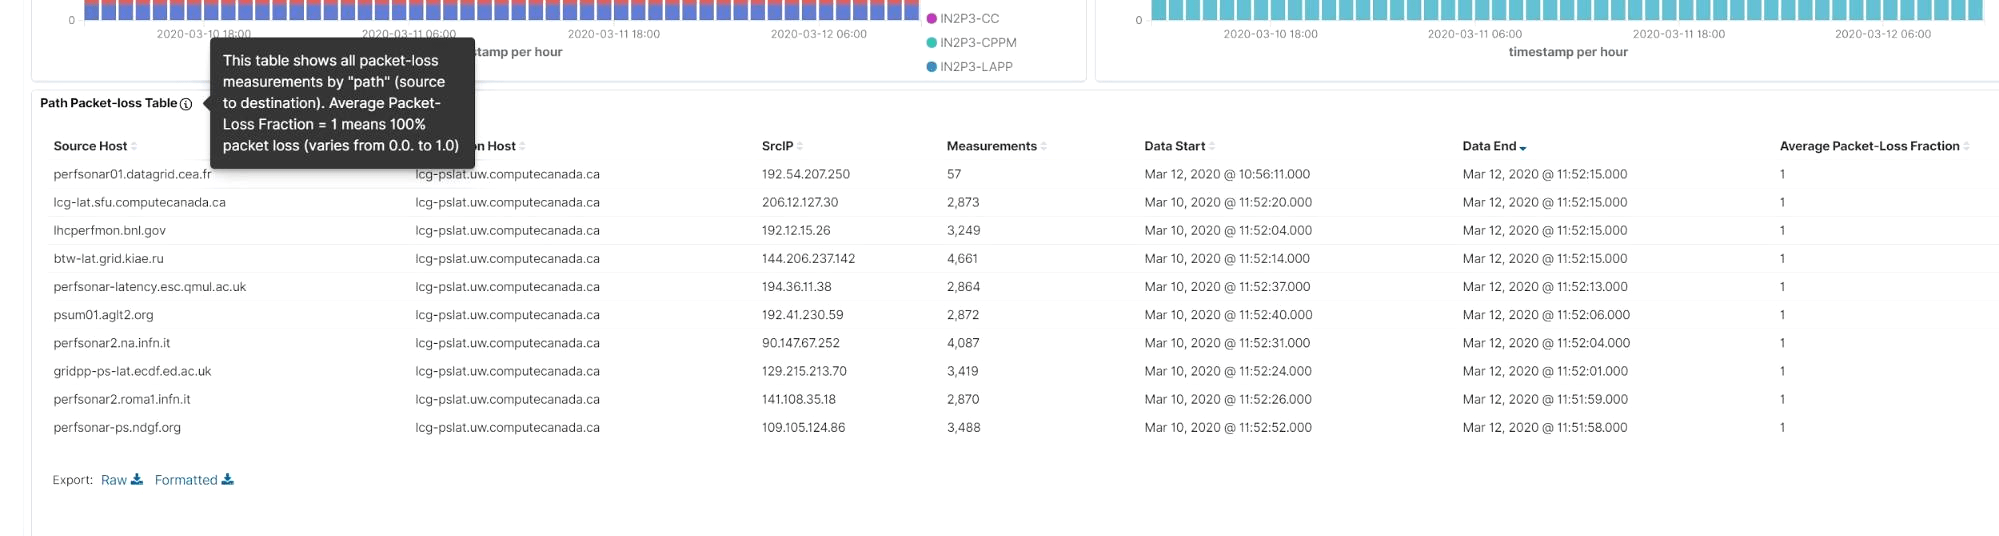
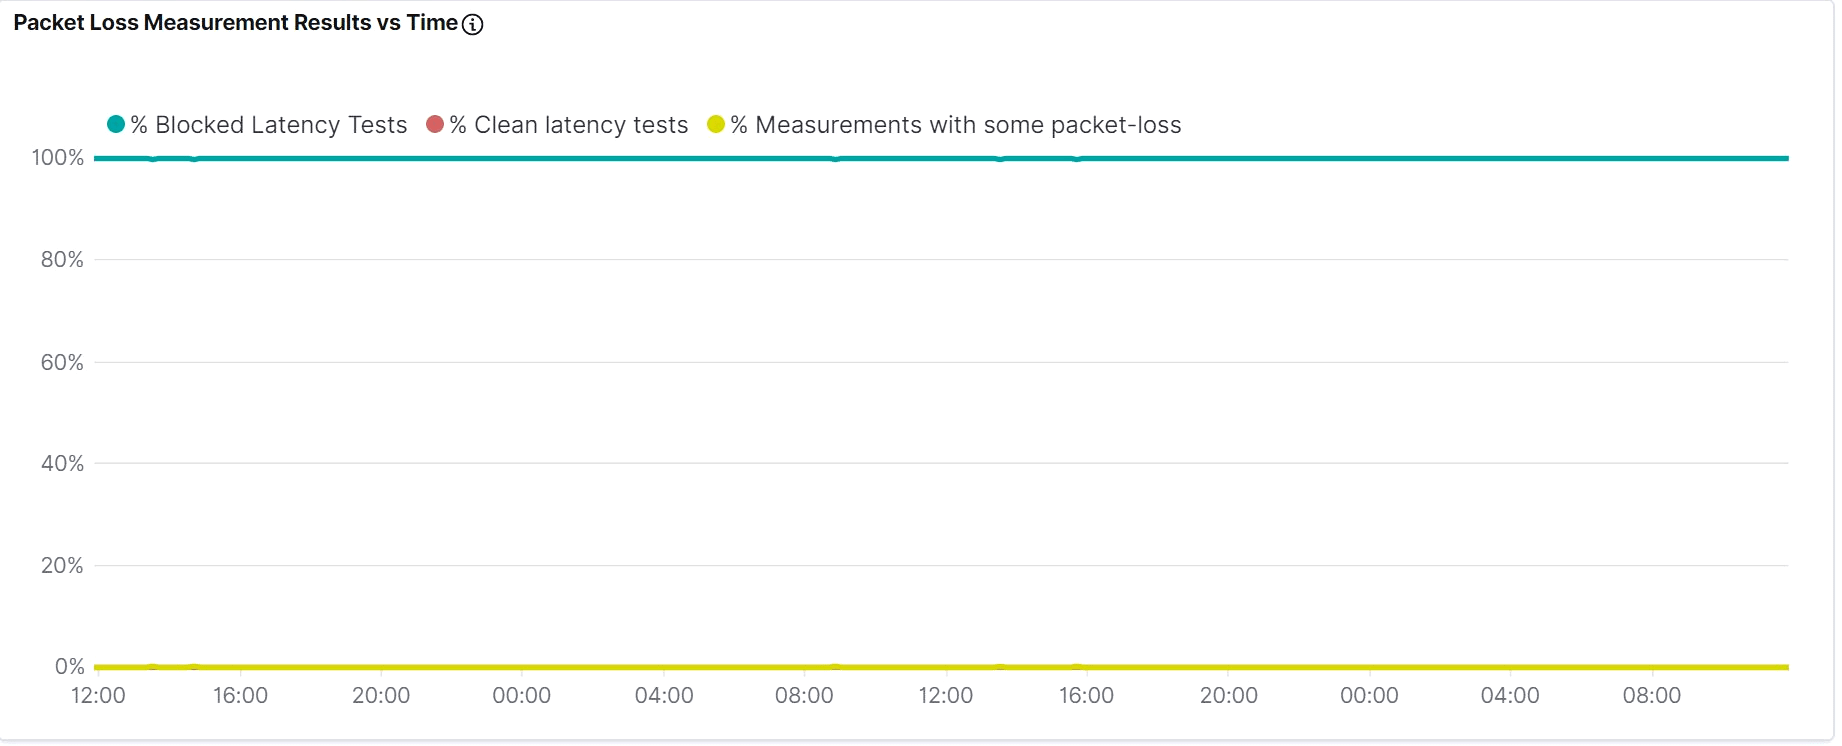
As shown above, another feature of the visualizations in our dashboard is an “information” icon (circle around an i). If you hover over it, you will see text describing the details of each visualization. The “Average Packet Loss Fraction” (last) column, shows 1 for measurements that have 100% packet loss. We can also see this by looking at the packet-loss vs time graph for the period of March 10-13, 2020:
We contacted Rolf Seuster, who is the Compute Canada perfSONAR contact (as well as the Canadian ATLAS perfSONAR contact), notifying him of the issue. By March 16, they were able to debug the cause: misconfigured firewall at the University of Waterloo. This plot shows the fix going into place (period is March 13-18, 2020):
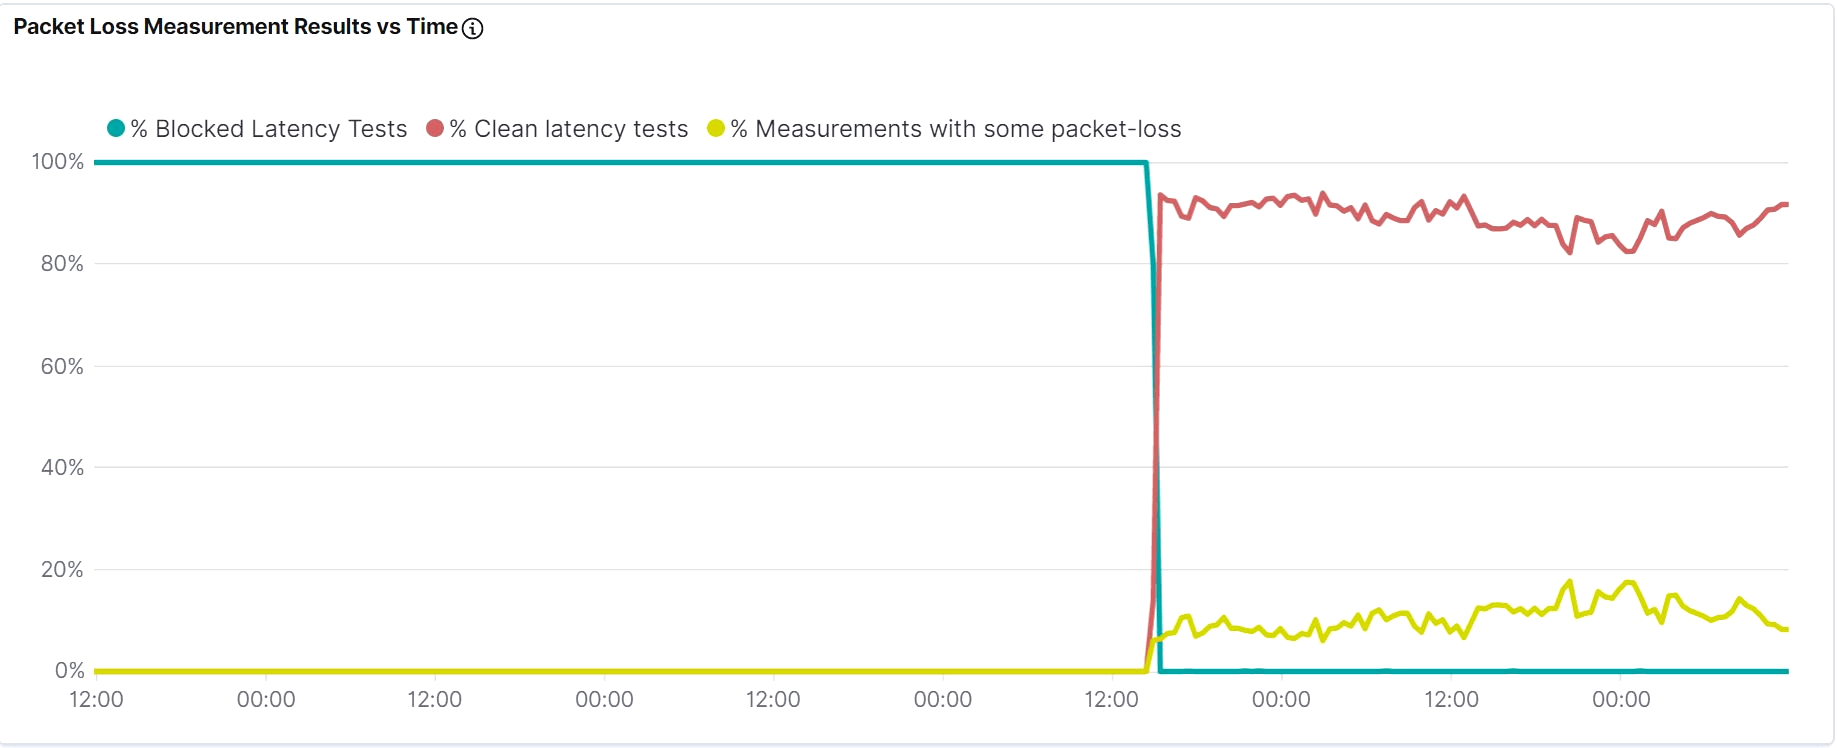
We are continuing to evaluate the various visualizations, with a focus on highlighting significant issues in both our network monitoring infrastructure and our R&E networks themselves.