SAND Technical Documentation
OSG/SAND Architecture
To understand and plan out the SAND architecture, we need to first review what we have developed in the OSG networking area, since this will serve as a basis for SAND to build upon.
OSG/SAND Data Pipeline
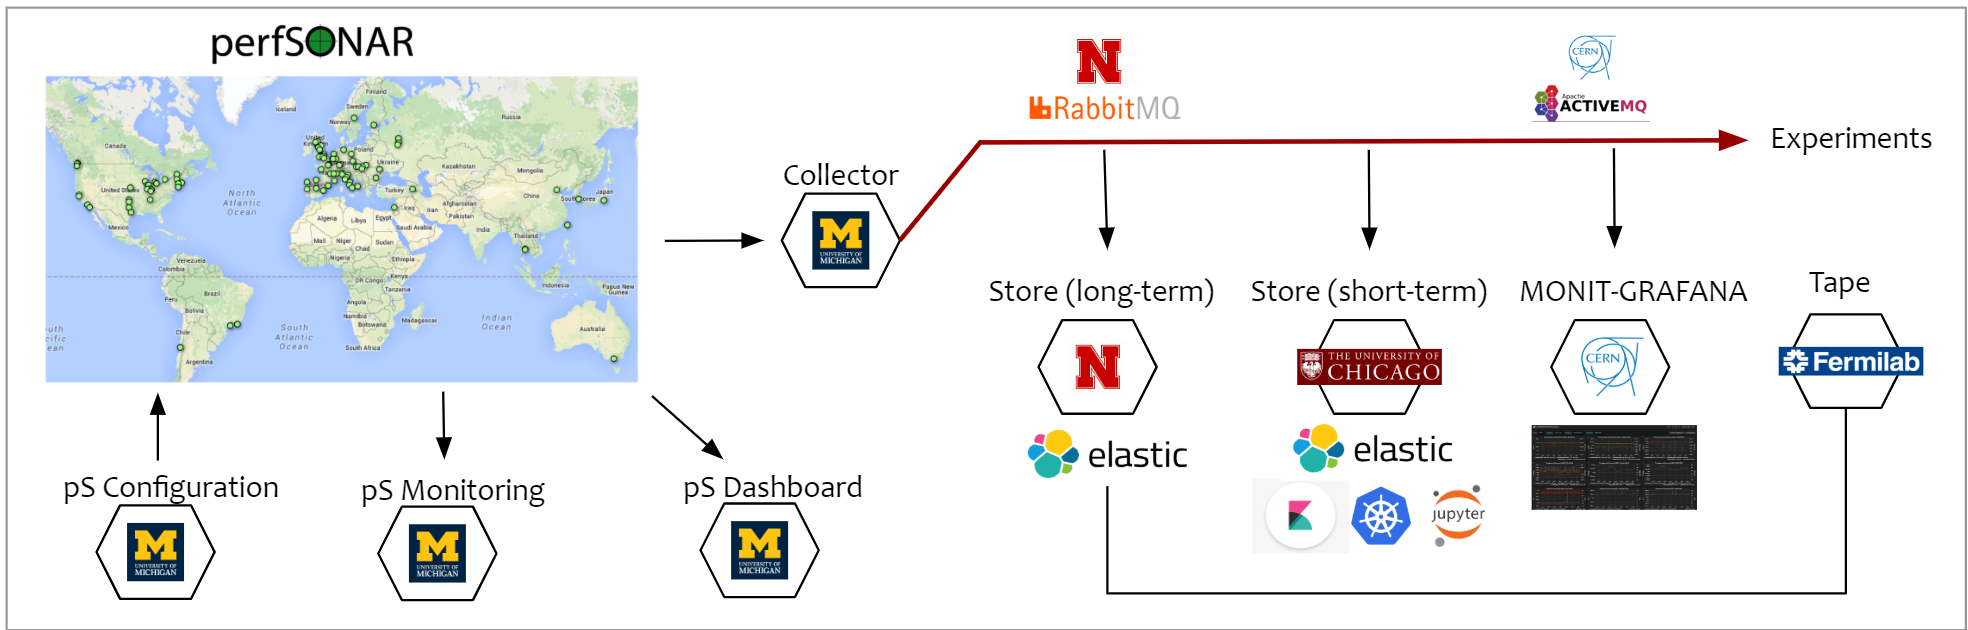
At the start of the SAND project, the network data pipline architecture had two message buses, each with their own subset of the data. Many of the components we unreliable and there were significant latency issues between data generation and having the data present in it’s long-term storage location. Our first task we to update the data pipeline to be more robust and conceptually easier, making the RabbitMQ bus the “primary” destination. Data was now “shoveled” onto the CERN ActiveMQ bus to feed the CERN Grafana instance. The following shows the data pipeline overview, starting from the set of globally distributed perfSONAR instances and leading to the various analytics platforms and dashboard providers.
OSG/SAND Service Component Overview
For SAND (and IRIS-HEP/OSG-LHC), we need to understand the details in the SAND-NMA architecture diagram above. There are multiple components shown. Starting from the upper left, we have the global perfSONAR infrastructure, deployed at various institutions, national labs and universities.
-
There are four components running at the University of Michigan: pSConfig (PWA), psetf (Check_MK), MaDDash (pS dashboard) and pefsonar-collector (gathers data and sends to RabbitMQ).
-
The University of Nebraska/Lincoln, runs another four components of the pipeline: the RabbitMQ bus (commercially hosted), a data ingestor that grabs data from the bus and and puts it into Elasticsearch, an Elasticsearch instance for long-term storage and a service pushing data to tape at Fermilab.
-
The University of Chicago provides two components: a data ingestor reading RabbitMQ and writing to Elasticsearch and a high-performance Elasticsearch for near real-time data analytics.
-
CERN is taking care of the process that reads from RabbitMQ and exports to the CERN ActiveMQ bus and is providing a MONIT Elasticsearch instance with separate Grafana dashboards to visualize the network data in the pipeline.
-
Fermilab is providing access to their tape archive for long-term backup of the data. The amount of 5-10 TB/year is easy to handle.
Additionally some of the LHC experiments, LHCb in particular, are using the network data from the bus to explore optimization of their workflows.
In the next few sections we will provide details about each of the above components including a brief description, relevant URLs (where publically accessible), monitoring details, components owners and who to contact if there are issues.
pSConfig (PWA)
psconfig.opensciencegrid.org
Responsible Organization: OSG-LHC
**Owner**: OSG, Shawn McKee <[[email protected]](mailto:[email protected])> (primary), WLCG, Marian Babik <[[email protected]](mailto:[email protected])> (secondary)

**Description**: This provides the previously name "Mesh Configuration GUI", now called PWA.  See [https://docs.perfsonar.net/pwa.html](https://docs.perfsonar.net/pwa.html) for details on this service.   This is the main configuration tool for the OSG/WLCG perfSONAR instances and defines the sets of hosts that test to each other, as well as the test parameters.  Toolkit instances need to be configured to use this service.

**Access info**:  Both admins and users can access the system via the web if they have an account.  Admins are currently Shawn McKee, Marian Babik and various others who have been assigned as admins for specific meshes, tests and hostgroups.

	**Admin**: [https://psconfig.opensciencegrid.org/auth/#!/signin](https://psconfig.opensciencegrid.org/auth/#!/signin)

     Users can (without credentials) query the pub interface:

	**User**: [http://psconfig.opensciencegrid.org/pub/config](http://psconfig.opensciencegrid.org/pub/config) (shows list of meshes)

                                        Or API documentation is at:

	[https://psconfig.opensciencegrid.org/apidoc/](https://psconfig.opensciencegrid.org/apidoc/)

**Verification info**:  Publisher health [https://psconfig.opensciencegrid.org/pub/health](https://psconfig.opensciencegrid.org/pub/health) or try to open one of the above URLs.

**Monitoring info**:  We use our `check_mk` monitoring on psetf [https://psetf.grid.iu.edu/etf/check_mk/index.py?start_url=%2Fetf%2Fcheck_mk%2Fview.py%3Fhost%3Dpsconfig%26site%3Detf%26view_name%3Dhost](https://psetf.grid.iu.edu/etf/check_mk/index.py?start_url=%2Fetf%2Fcheck_mk%2Fview.py%3Fhost%3Dpsconfig%26site%3Detf%26view_name%3Dhost)
FYI, all the Opensciencegrid production network services are monitored in the Business Intelligience check_mk setup at https://psetf.opensciencegrid.org/etf/check_mk/index.py?start_url=%2Fetf%2Fcheck_mk%2Fview.py%3Fview_name%3Daggr_all
psetf (Check_MK) service monitoring
psetf.opensciencegrid.org
Responsible Organization: OSG-LHC
**Owner**: Marian Babik <[[email protected]](mailto:[email protected])> (primary), Shawn McKee <[[email protected]](mailto:[email protected])> (secondary)

**Description**:  This is the ETF ([http://etf.cern.ch/docs/latest/](http://etf.cern.ch/docs/latest/) ) for perfSONAR.   It is a set of containers that run check_mk (Nagios-based service checking) to track perfSONAR services and servers as well as test results.

**Access info**:  Users DN is used.  You need to have a X.509 credential in your browser from an IGTF CA and you will automatically be allowed to access the web interface as a user.  Certain users are mapped to the Admin account (Shawn McKee, Marian Babik)

	Admin: https://psetf.opensciencegrid.org/etf/check_mk/

	User: https://psetf.opensciencegrid.org/etc/check_mk/

**Verification info**: Open the main web page:  [https://psetf.opensciencegrid.org/etf/check_mk/](https://psetf.opensciencegrid.org/etf/check_mk/)

	Alternately SSH into [[email protected]](mailto:[email protected]) (if your key is in place) and do "`docker ps`" to verify the ps_etf and rmq containers are running.

**Monitoring info**:  The psetf instance monitors itself at [https://psetf.opensciencegrid.org/etf/check_mk/index.py?start_url=%2Fetf%2Fcheck_mk%2Fview.py%3Fhost%3Dpsetf%26site%3Detf%26view_name%3Dhost](https://psetf.grid.iu.edu/etf/check_mk/index.py?start_url=%2Fetf%2Fcheck_mk%2Fview.py%3Fhost%3Dpsetf%26site%3Detf%26view_name%3Dhost)   The instances also publishes data to the RabbitMQ bus via the 'rmq' container running in Docker on the psetf.opensciencegrid.org host system.  It publishes these two topics:  perfsonar.summary.meta and perfsonar.summary.status on the RMQ bus.  FYI, all the Opensciencegrid production network services are monitored in the Business Intelligience check_mk setup at [https://psetf.opensciencegrid.org/etf/check_mk/index.py?start_url=%2Fetf%2Fcheck_mk%2Fview.py%3Fview_name%3Daggr_all](https://psetf.opensciencegrid.org/etf/check_mk/index.py?start_url=%2Fetf%2Fcheck_mk%2Fview.py%3Fview_name%3Daggr_all)
MaDDash Dashboards
psmad.opensciencegrid.org
** Responsible Organization**: WLCG Throughput WG
**Owner: **Shawn McKee (primary), Marian Babik, Andy Lake / ESnet
** Description: **This runs the ESnet created MaDDash service (Monitoring and Diagnostics Dashboard) which displays perfSONAR metric results in a concise manner.
** Access info: **https://psmad.opensciencegrid.org/maddash-webui/index.cgi
** Verification info: **Confirm access URL above responds. Verify mesh results for the list meshes in the menu.
** Monitoring info: **FYI, all the Opensciencegrid production network services are monitored in the Business Intelligience check_mk setup at https://psetf.opensciencegrid.org/etf/check_mk/index.py?start_url=%2Fetf%2Fcheck_mk%2Fview.py%3Fview_name%3Daggr_all
pSCollector (pS data gathering)
psrsv.opensciencegrid.org
** Responsible Organization**: SAND
**Owner: **Edgar
** Description: **It is a group of RSV(https://github.com/opensciencegrid/rsv) probes (one for each toolkit instance) that collect information from the perfsonar toolkits and push them to RabbitMQ (https://github.com/opensciencegrid/rsv-perfsonar). The active probes are the ones that show up in at least one of the meshes.
** Access info: **AGLT2 admins, Shawn and Edgar (Dev)
** Admin: **Edgar
** User: **Shawn
** Verification info: **Most sites should be green here (http://psrsv.opensciencegrid.org/rsv/)
** Monitoring info: **FYI, all the Opensciencegrid production network services are monitored in the Business Intelligience check_mk setup at https://psetf.opensciencegrid.org/etf/check_mk/index.py?start_url=%2Fetf%2Fcheck_mk%2Fview.py%3Fview_name%3Daggr_all
** Source code:** https://github.com/opensciencegrid/rsv-perfsonar
perfSONAR Infrastructure
perfSONAR Infrastructure
** Responsible Organization**: Participating sites
**Owner: **Site service, owned by sites running the sonars
** Description: **perfSONAR toolkits taking network performance measurements
** Access info: **Open https://
** Admin: **Site manager/admin have admin access. Tests can be configured centrally via psconfig.opensciencegrid.org (or locally via toolkit web interface)
** User: **Open
** Verification info: **Toolkit web page should load and show recent results. Data quality is verified by corresponding tool providers (iperf3, traceroute, owamp, etc.). This would be in most cases ESNet.
** Monitoring info: **psetf.opensciencegrid.org provides comprehensive monitoring of the infrastructure (metrics are listed at http://opensciencegrid.org/networking/perfsonar/faq/)
RabbitMQ Bus
RabbitMQ Bus
** Responsible Organization**: OSG-Core
**Owner: **Derek / MarianZ
** Description:** Hosted RabbitMQ on the commercial service CloudAMQP
** Access info:**
** Admin: **Derek, MarianZ, Brian B, John
** User:**
** Verification info:** No public data quality monitors. CloudAMQP has an extensive web interface for viewing the RabbitMQ configuration.
** Monitoring info:** If messages build up on the queue, we get an alert (GRACC admins). Nothing on “too few messages” https://gracc.opensciencegrid.org/dashboard/db/rabbitmq-queues \
ActiveMQ Bus
ActiveMQ Bus
** Responsible Organization**: CERN IT
**Owner:** Lionel Cons (or designate from CERN Messaging Team)
** Description: **Dedicated cluster of ActiveMQ nodes for the network measurements
** Access info: netmon-mb.cern.ch **(ActiveMQ web console for nodes behind alias is accessible inside CERN)
** Admin:** Lionel Cons
** User: **via SNOW/GGUS ticket to CERN messaging team
** Verification info: **No data quality monitors
** Monitoring info: **Notifications/alerting on data missing on particular topic is provided by CERN MIG and is sent to perfsonar-esmond-mq e-group (@cern.ch)
ESnet Collector
ESnet Collector
** Responsible Organization**: SAND
**Owner: **Ilija Vukotic, UChicago
** Description: Currently implemented as collector inserting directly to UC ES, but **prototype using ActiveMQ was implemented some time ago; it’s at https://gitlab.cern.ch/network-analytics/esnet-traffic
** Access info:**
** Admin:**
** User:**
** Verification info:**
** Monitoring info:**
**Notes**: Currently bypasses our RabbitMQ bus. Need to rework the process to send to the bus and update the collectors to push this data to our ES instances.
LHCOPN Collector
LHCOPN publisher
** Responsible Organization**: CERN IT / CS
**Owner: **CERN IT/CS
** Description: **Provides LHCOPN traffic as seen by the CERN central routers (as LHCOPN has star-like topology this is most of the traffic, but not all traffic as there can be p2p links).
** Access info: **Published to CERN AMQ via internal component/service run by CERN IT/CS
** Admin: **Veronique Lefebure (CERN IT/CS)
** User: **Accessible via subscription to the CERN AMQ lhcopn topic
** Verification info: **Stream available via subscription; no data quality monitors.
** Monitoring info: **Notification system is in place to alert in case rate of messages for lhcopn topic drops below threshold (this notification is sent directly to IT/CS)
** Notes**: There are data privacy issues here that need to be worked out with CERN IT (initial contact should be Edoardo Martelli). Data is sent to CERN ActiveMQ bus but not integrated with the rest of the system.
CERN MONIT (Elasticsearch)
MONIT Elasticsearch (CERN)
**Owner: **CERN IT/MM
** Description: **ES subscribing to network topics available from ActiveMQ
** Access info: **https://monit-kibana.cern.ch/
** Admin: **CERN MONIT
** User: **Open to anyone with CERN account
** Verification info: **Data should be accessible at https://monit-kibana.cern.ch/
** Monitoring info: **CERN MONIT internal monitoring
** Note**: Consumers of the data.
CERN Grafana Dashboards
Grafana (CERN)
**Owner:** CERN IT/MM
** Description: **Grafana dashboard connected to UC ES and CERN ES
** Access info: **http://monit-grafana-open.cern.ch
** Admin: **Marian Babik, CERN MONIT team
** User: **Open to anyone
** Verification info: **http://monit-grafana-open.cern.ch alive and showing data
** Monitoring info: **CERN MONIT internal monitoring
** Note**: Consumers of the data.
perfSONAR Data Collector
perfSONAR_collector (Nebraska->ES(UC))
pscollectors.opensciencegrid.org
**Owner: **MarianZ
** Description: **Collectors for perfSONAR data. Collect from ActiveMQ and sends to Elasticsearch.
** Access info**
** Admin: **Ilija, MarianB
** User: **
** Verification info:**
- Look at the RabbitMQ monitoring and see if the queue has built up.
- Log in to pscollectors.opensciencegrid.org and see if the corresponding docker containers are running. Even if they are running, they could be wedged.
- “
docker exec” into container and check logfiles in/var/log/*.
** Monitoring info: **can implement check_mk which is run under UNL infrastructure
** Source code**: https://github.com/djw8605/PerfSONAR_collectors (will be moved to the SAND organization)
perfSONAR Data Ingestor
perfSONAR_collector (Nebraska->ES(UNL))
pscollectors.opensciencegrid.org
**Owner:** MarianZ
** Description:** same as Nebraska->EC(UC).
** Access info:**
** Admin: **Ilija, MarianB
** User:**
** Verification info:**
** Monitoring info:**
** Source code**: https://github.com/djw8605/PerfSONAR_collectors (will be moved to the SAND organization)
Data Tape Archiving
RabbitMQ -> GRACC service -> FNAL tape
**Owner: **Derek / MarianZ
** Description: **2 separate services. One that is always running and archiving messages into a .tar.gz file on the gracc frontend. Another that runs periodically that uploads the completed .tar.gz files to tape at FNAL
** Access info:**
** Admin: **Derek, MarianZ, John
** User:**
** Verification info:** Weekly email with positive results of copying to FNAL tape
** Monitoring info:** check_mk on all of the services. If copy fails, we get service failed email. If the always running service stops, we get an email.
RabbitMQ to ActiveMQ Bridge
RabbitMQ to ActiveMQ Bridge
**Owner: **Marian Babik
** Description:** Hosted at CERN using stompclt docker image
** Access info: **Runs on etf-60.cern.ch in the CERN cloud
** Admin: **Marian B
** User: **LHCb/DIRAC, CERN/MONIT
** Verification info:** See AMQ Bus description
** Monitoring info:** See AMQ Bus description (If there are no messages in one of the topics on AMQ, an e-mail alert is generated by the AMQ service and sent to perfsonar-esmond-mq e-group)